Discover the next set of top TradingView indicators: Relative Volatility Index, Average True Range, Volume Profile, and Ichimoku Cloud, each offering unique insights for effective trading on TradeLocker.
Welcome to the second and final part of a short series about TradingView’s top indicators that are available natively on TradeLocker. You can read part 1 here.
Key Takeaways
- Relative Volatility Index (RVI): Offers insights into market volatility by focusing on the standard deviation of price changes, aiding in identifying potential market reversals and overbought/oversold conditions.
- Average True Range (ATR): Measures volatility without indicating price direction, essential for understanding the magnitude of market movements and identifying periods of low or high market volatility.
- Volume Profile: Provides a unique perspective on market behavior by displaying volume at different price levels, helping traders identify key support and resistance areas through High Volume Nodes (HVN) and Low Volume Nodes (LVN).
- Ichimoku Cloud: A comprehensive trend-following tool that combines multiple indicators, including moving averages and cloud formations, to offer a broad view of market trends, momentum, and key trading levels.
5. Relative Volatility Index
The Relative Volatility Index (RVI) is a volatility indicator to measure the fluctuations in price relative to past volatility. This indicator offers traders a nuanced understanding of market volatility, making it an invaluable tool for identifying potential entry and exit points in trading strategies.
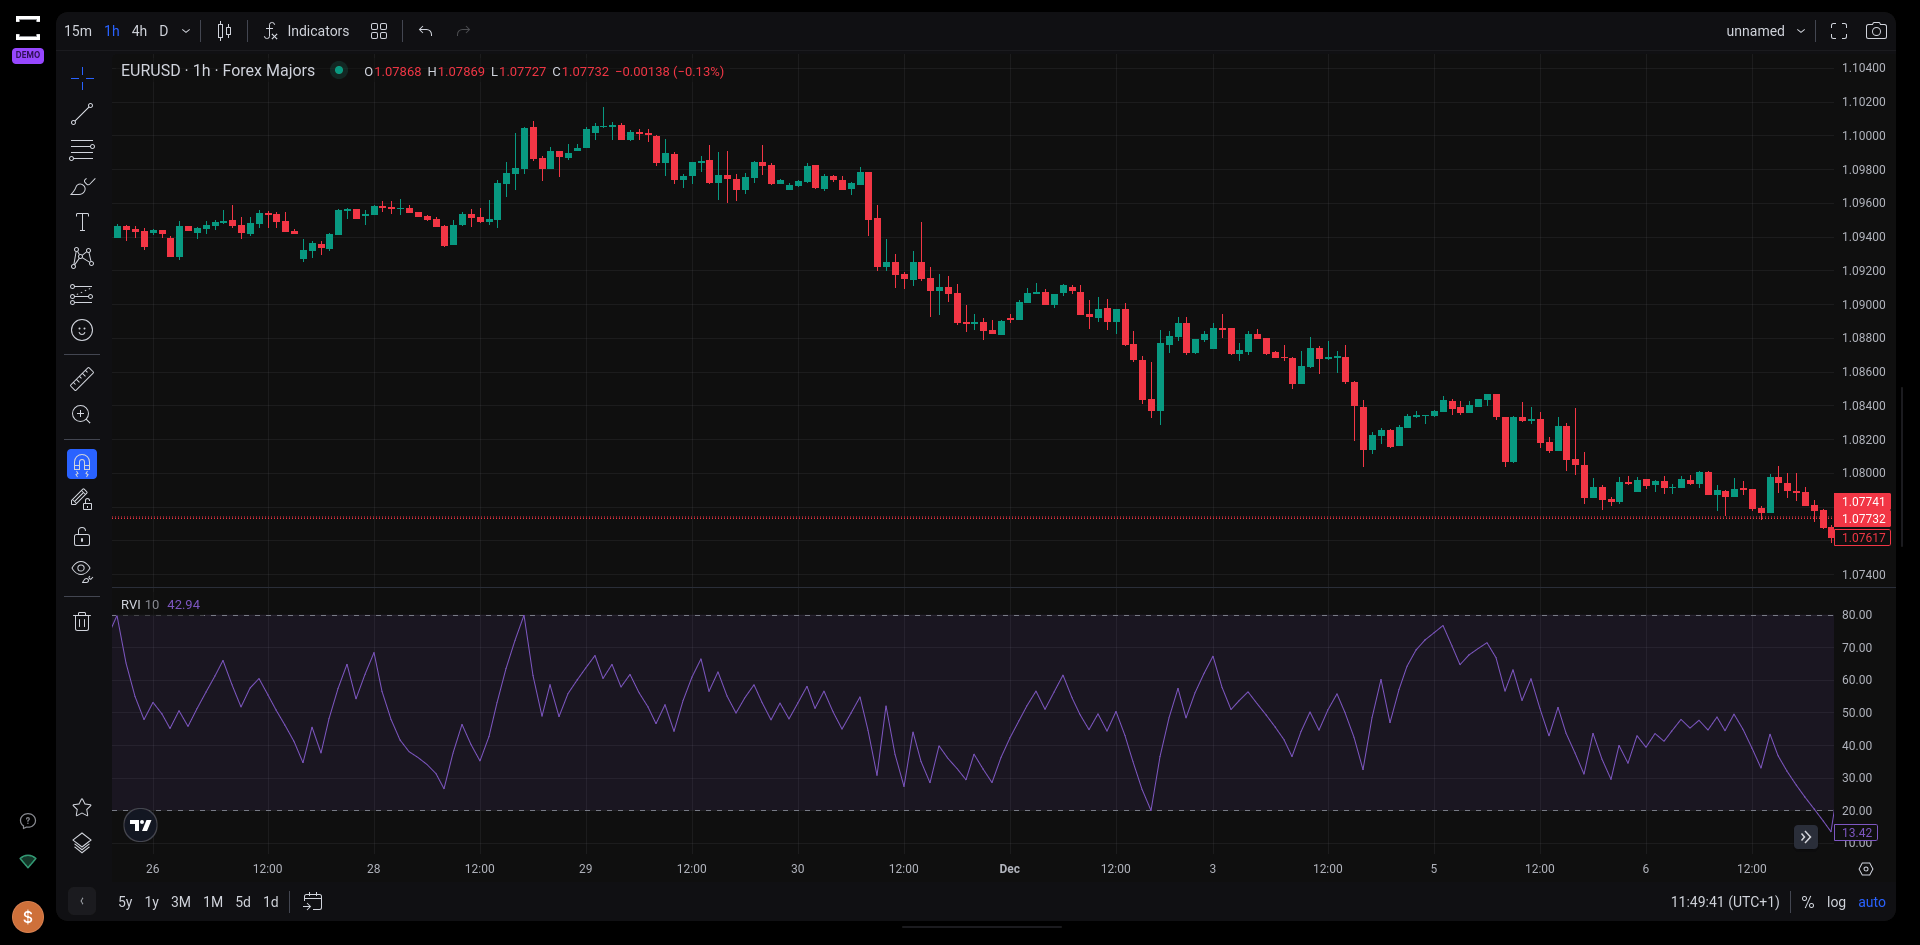
The RVI TradingView indicator on Tradelocker.
Key Features of the Relative Volatility Index
- Measurement of Price Fluctuations: The RVI focuses on the standard deviation of price changes over time, providing a dynamic view of market volatility.
- Indicator Range and Interpretation: Ranging from 0 to 100 on the chart, the RVI indicates higher volatility levels when the values are above 50, suggesting a potential buy signal. Conversely, values below 50 hint at decreased volatility, possibly signaling a sell opportunity.
- Comparison with RSI: While similar to the Relative Strength Index (RSI) in some respects, the RVI distinguishes itself by measuring the standard deviation of price changes rather than absolute price movements.
Advantages and Usage of RVI in Trading
- Identifying Market Reversals: The RVI is particularly effective in signaling when prices might reverse direction, aiding traders in timing their trades.
- Determining Overbought and Oversold Conditions: Like the RSI, the RVI can be used to identify conditions where an asset is overbought or oversold, thus informing more calculated trading decisions.
- A Confirming Indicator: According to its original creator, Donald Dorsey, the RVI serves as a “confirming indicator,” providing additional insights and data that may be absent in the RSI’s calculations.
6. Average True Range (ATR)
The Average True Range (ATR) is another volatility indicator, renowned for its effectiveness in measuring both the magnitude and direction of price movements. Unlike many indicators that focus on price direction, the ATR specializes in quantifying volatility.
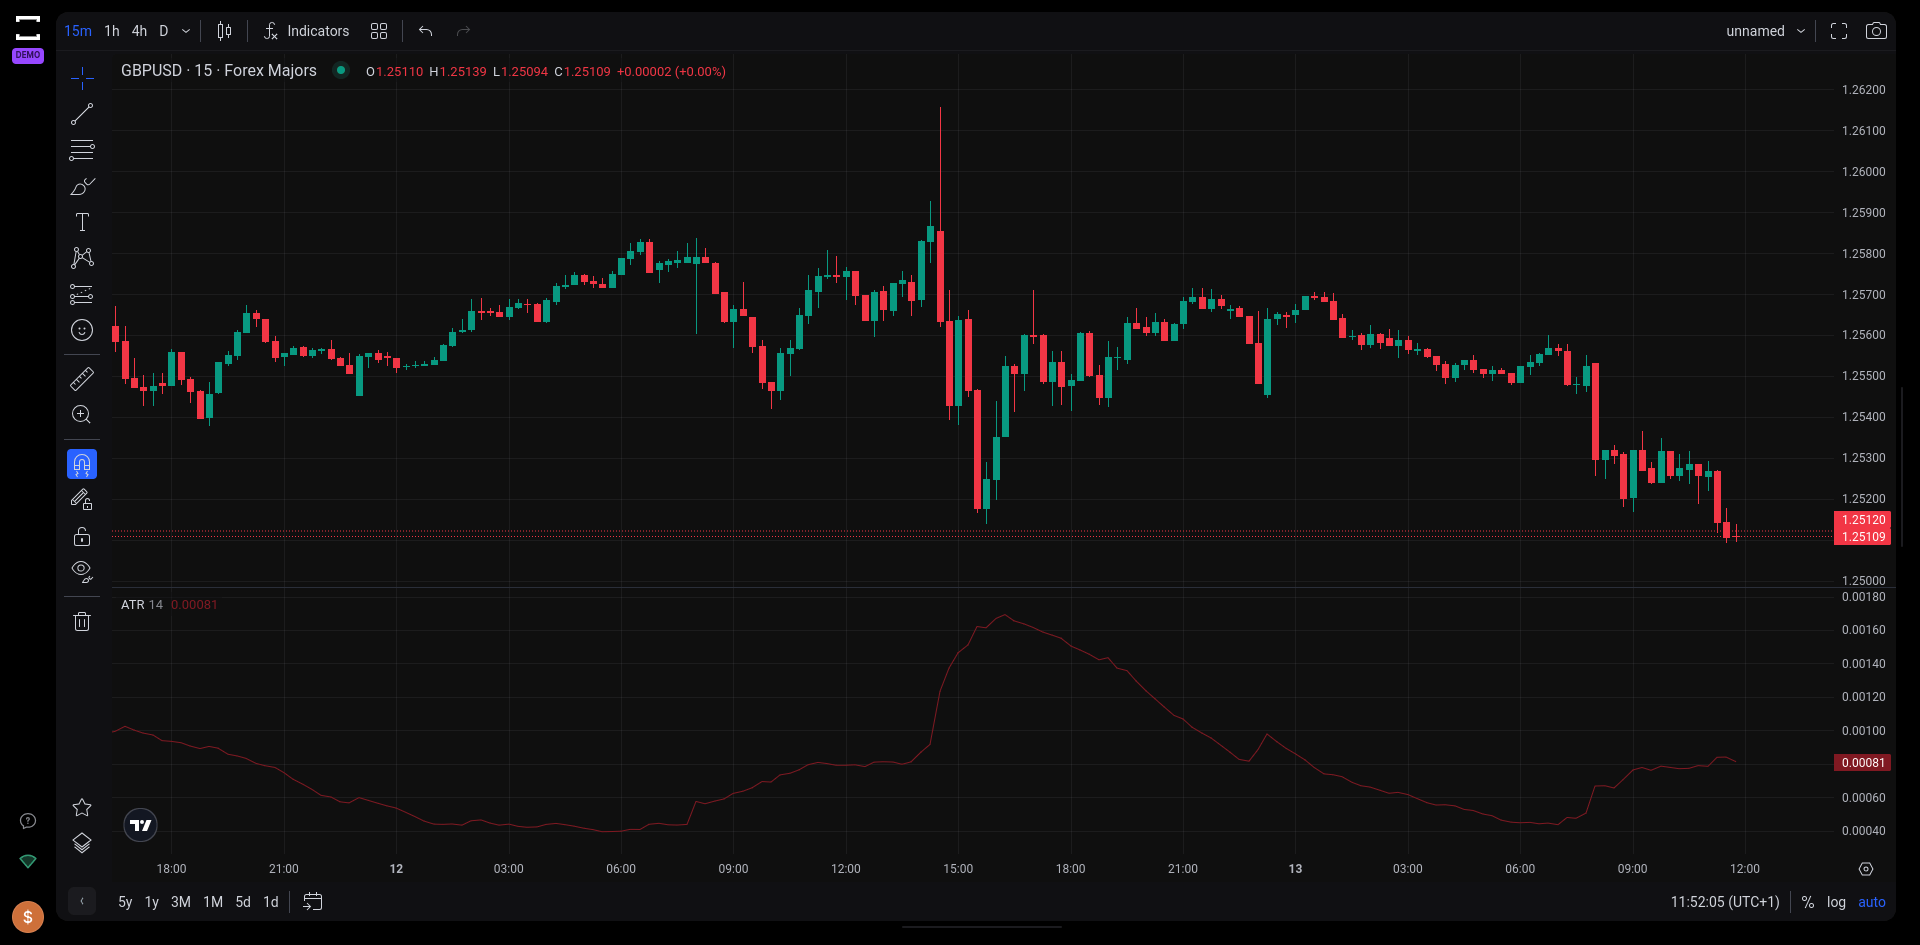
The ATR TradingView indicator on Tradelocker.
Key Characteristics of the Average True Range
- Volatility Measurement: ATR expresses volatility as an oscillator, with its values ranging from 0 to infinity. High ATR values may signal an increase in market volatility.
- Indicating Potential Price Movements: While ATR does not predict the direction of the trend, it is useful in indicating the potential magnitude of price movements, a critical aspect for day traders and those analyzing market momentum.
Usage and Interpretation of ATR
- Continuous Plot Line: The ATR is typically plotted as a continuous line beneath the main price chart, providing a clear visual representation of volatility over time.
- Interpreting ATR Values: A higher ATR value indicates greater volatility. Traders often use a common 14-day period for ATR calculations, but it can be adjusted to suit different trading styles and timeframes.
- Measuring the Strength of Market Moves: The ATR excels in measuring the strength of a price move, regardless of its direction. An increasing ATR in response to a price move signifies strong market interest or pressure behind that move.
Considerations When Using ATR
- Understanding Absolute Value in ATR Calculation: The ATR uses absolute values in its calculation, meaning securities with higher price values will inherently show higher ATR values. This aspect is crucial as it implies that ATR values are not directly comparable across different securities. Traders must consider the ATR in the context of each specific security.
- Identifying Trading Ranges and Market Strength: The ATR can help identify periods of sustained sideways movement (low volatility) and trading ranges. It serves as a complementary tool to price direction indicators, adding confidence in the strength of a market move.
7. Volume Profile
The Volume Profile is a charting tool that offers a unique perspective on trading activity, going beyond traditional volume analysis. This advanced indicator focuses on volume by price, rather than volume by time, providing traders with deeper insights into market behavior.
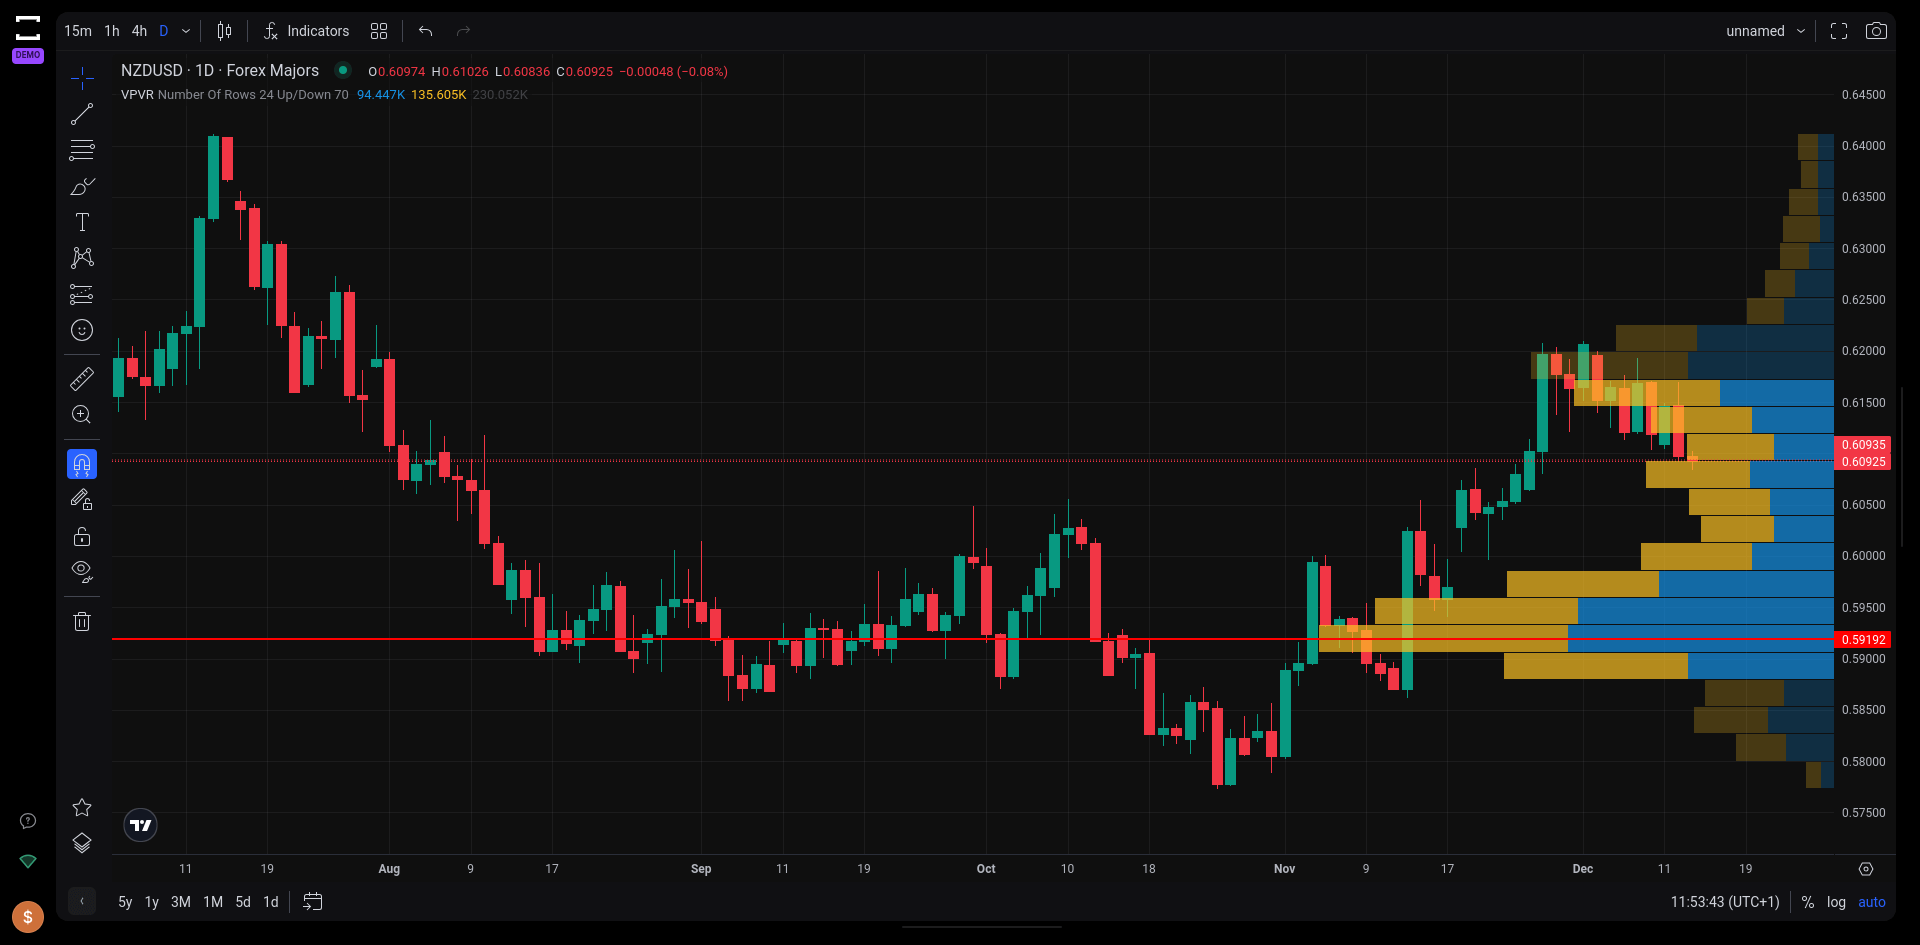
The Volume Profile TradingView indicator on Tradelocker.
Understanding Volume Profile
- Volume by Price: Unlike traditional volume charts that display volume over time, the Volume Profile shows volume at different price levels for a specified time period. This shift in perspective is crucial for traders looking to understand supply and demand dynamics at specific price points.
- Histogram Presentation: The Volume Profile is presented as a histogram on the chart. It divides the total volume traded at a specific price level during a set time frame into ’up volume’ and ’down volume’, thereby making key price levels where significant trading activity occurred easily visible.
Key Applications of Volume Profile
- Support and Resistance Levels: Traders primarily use the Volume Profile to identify support and resistance levels. It’s important to note that this method is reactive, based on past price movements and volume behavior, unlike proactive methods such as trend lines and moving averages. A price level with a high volume of buys, for example, may indicate a strong support level.
- High Volume Nodes (HVN): HVNs are peaks in the volume profile and signify consolidation periods or “fair value areas”. The market tends to exhibit sideways movement when approaching a previous HVN, indicating a balanced area of buy and sell activity.
- Low Volume Nodes (LVN): In contrast, LVNs represent valleys or significant drops in volume and are often associated with breakout rallies or breakdowns. These areas suggest “unfair value areas” where the market is likely to move through quickly.
Versatility and Relevance of Volume Profile
The Volume Profile stands out for its versatility and indisputable utility in technical analysis. Its data provides clear insights, allowing traders to devise both reactive and proactive strategies. While it excels in identifying traditional support and resistance areas, innovative traders continually find new ways to apply the Volume Profile in predictive analysis. An example is comparing real-time events, like the current day’s open, with historical volume profiles to inform trading decisions.
In TradeLocker’s TradingView integration there are two Volume Profile Indicators available to you: Fixed and Visible range. They do the same thing, but with the former you choose the range by clicking on two points on the charts, the latter will plot the volume levels based on the price range of the Y axis of your chart.
8. Ichimoku Cloud
The Ichimoku Cloud is a comprehensive and dynamic trend-following indicator used in technical analysis. This multifaceted tool combines multiple elements, including moving averages and a “cloud” formation, to offer traders a holistic view of the market trend, momentum, support, and resistance levels.
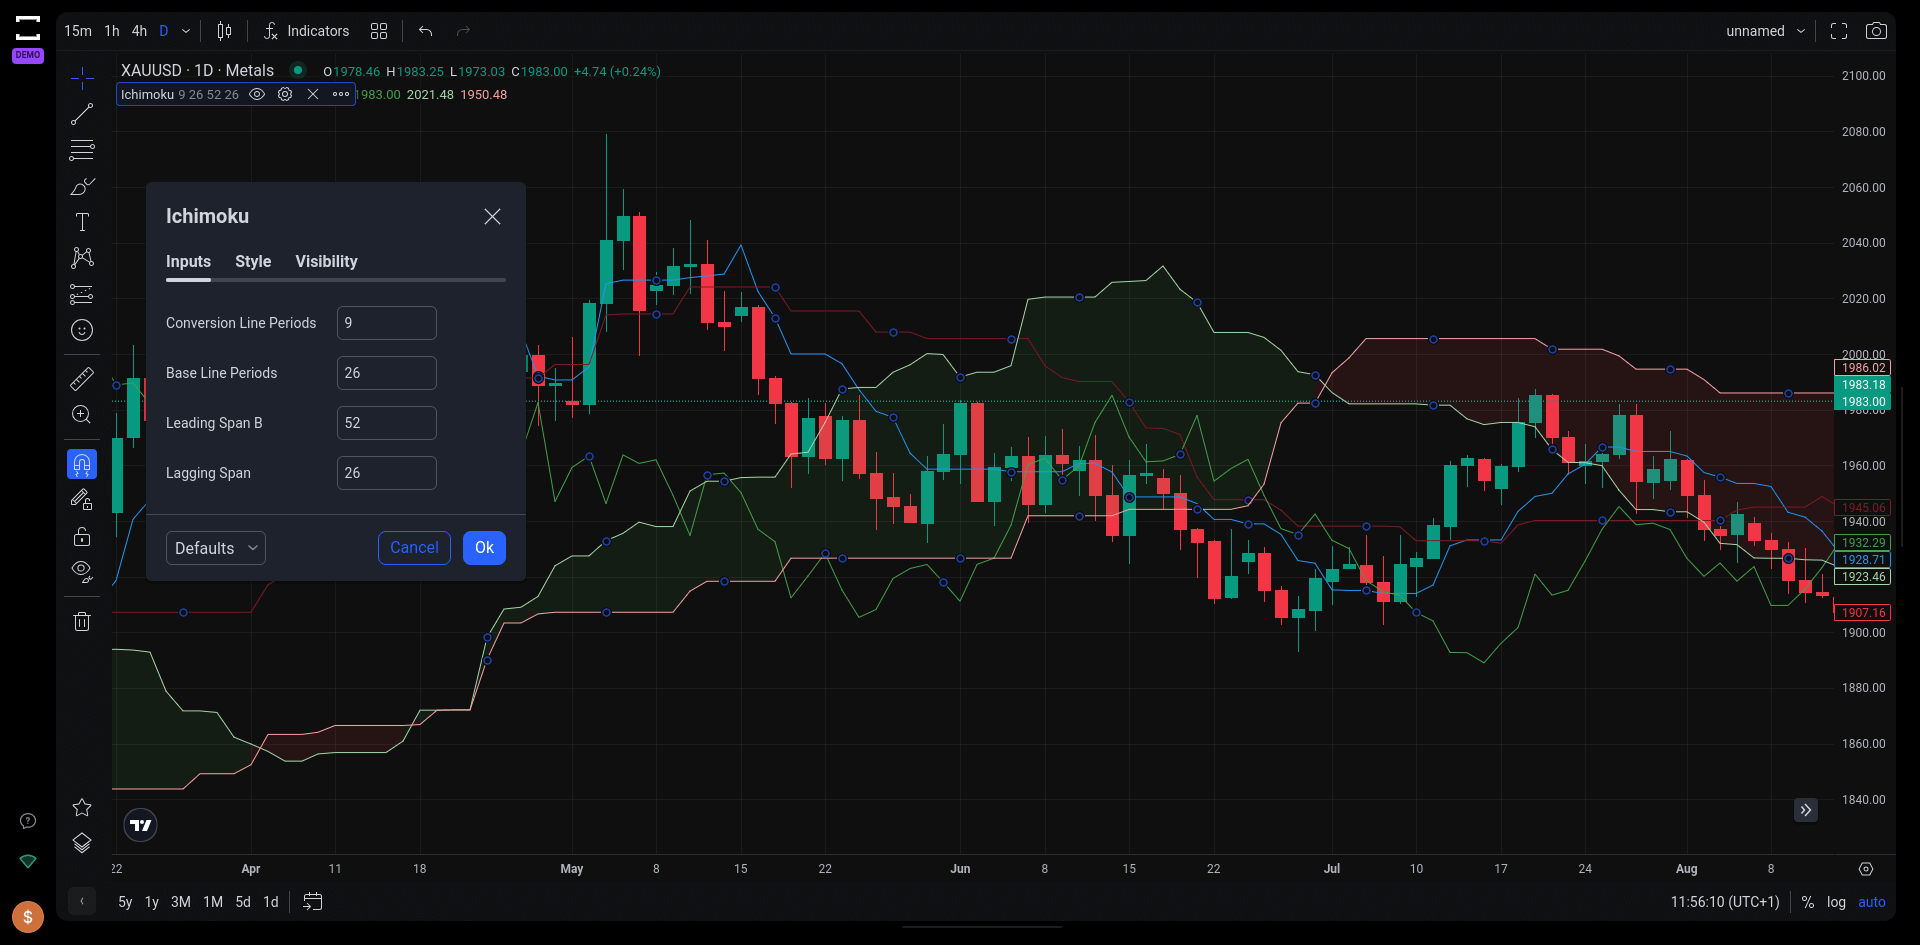
The Ichimoku Cloud TradingView indicator on Tradelocker.
Components and Functionality of the Ichimoku Cloud
- Five-Line Structure: The Ichimoku Cloud comprises five distinct lines, each contributing to the overall analysis of the market. These lines include the baseline and the conversion line, which function similarly to the 9-day and 26-day Exponential Moving Averages (EMAs), respectively.
- Cloud Formation and Color Coding: The ‘cloud’ is formed by the interaction of two of these lines. A green cloud indicates an uptrend, while a red cloud suggests a downtrend. This color-coded system makes it easier for traders to visually assess market trends.
- TK Crossovers: The crossover points between the baseline and conversion line (TK crossovers) are used to determine potential entry and exit points in trading strategies.
Key Takeaways and Usage
- Trend Identification: The position of the price relative to the cloud helps identify the overall trend direction. Price below the cloud signifies a downtrend, while price above the cloud indicates an uptrend.
- Strength of Signals: The trend signals are stronger if the price and the cloud move in the same direction. Conversely, signals may weaken if the cloud moves in the opposite direction to the price.
Limitations and Customizations
- Visual Complexity: The Ichimoku Cloud can appear crowded due to its multiple lines and shaded areas. However, platforms like TradingView (and, of course, TradeLocker) offer customization options, allowing users to hide certain lines or modify their appearance for a cleaner chart view.
- Historical Data Basis: The indicator is rooted in historical data, which limits its predictive capabilities for future market trends.
- Relevance in Static Markets: In situations where the price remains consistently below or above the cloud, the cloud itself may become less relevant. In such cases, other lines like the conversion or baseline assume greater importance, adapting more closely to current price levels.
Final Thoughts About the Top TradingView Indicators
Over these two parts, we’ve explored eight of TradingView’s most impactful indicators, each offering unique insights into the financial markets. From the volume-centric insights of VWAP and the Volume Profile to the trend-detecting capabilities of the SuperTrend and Ichimoku Clouds, these tools provide traders with a comprehensive set of instruments for analyzing market behavior.
The Relative Strength Index and Relative Volatility Index excel in momentum and volatility analysis, while the Average True Range offers a nuanced view of market volatility without predicting price direction. The Ichimoku Cloud, with its multifaceted approach, combines trend analysis with momentum and support/resistance levels, embodying the complexity and depth these indicators can offer.
As we conclude this series, remember that the effective use of these indicators requires practice, patience, and continuous learning. Whether you’re a novice trader starting on TradeLocker or a seasoned market participant, these tools can significantly enhance your trading strategies when used judiciously and in conjunction with a sound understanding of market dynamics.
Ready to become a funded trader? Start Now.