
Indicators are fun and they are useful. TradingView offers a suite of indicators that have become vital tools for traders worldwide and TradeLocker integrates them natively, so you don’t have to constantly switch between platforms. In this two-part series, we delve into the top TradingView indicators and how to use them. This first part covers four essential indicators: VWAP, SuperTrend, RSI, and DMI, providing insights into their functionality and applications.
Here we go.
Key Takeaways
- VWAP (Volume Weighted Average Price): A crucial volume indicator for identifying intraday trends, entry and exit points, and analyzing institutional trading activity.
- SuperTrend Indicator: Utilizes ATR and a multiplier factor for trend identification and reversal signals, adaptable to various trading styles and timeframes.
- Relative Strength Index (RSI): An effective momentum oscillator for evaluating overbought or oversold conditions and spotting price divergences.
- Directional Movement Index (DMI): Combines ADX, DI+, and DI- for a comprehensive analysis of trend strength and direction, aiding in strategic trading decisions.
1. VWAP
The Volume Weighted Average Price (VWAP) is a very common volume indicator, offering traders a unique lens to gauge market dynamics. VWAP merges price and volume data over a specific period, rendering a comprehensive view of the market’s pulse. This blend of price and cumulative volume data creates a robust framework for traders to pinpoint potential entry and exit points in their trading strategies.
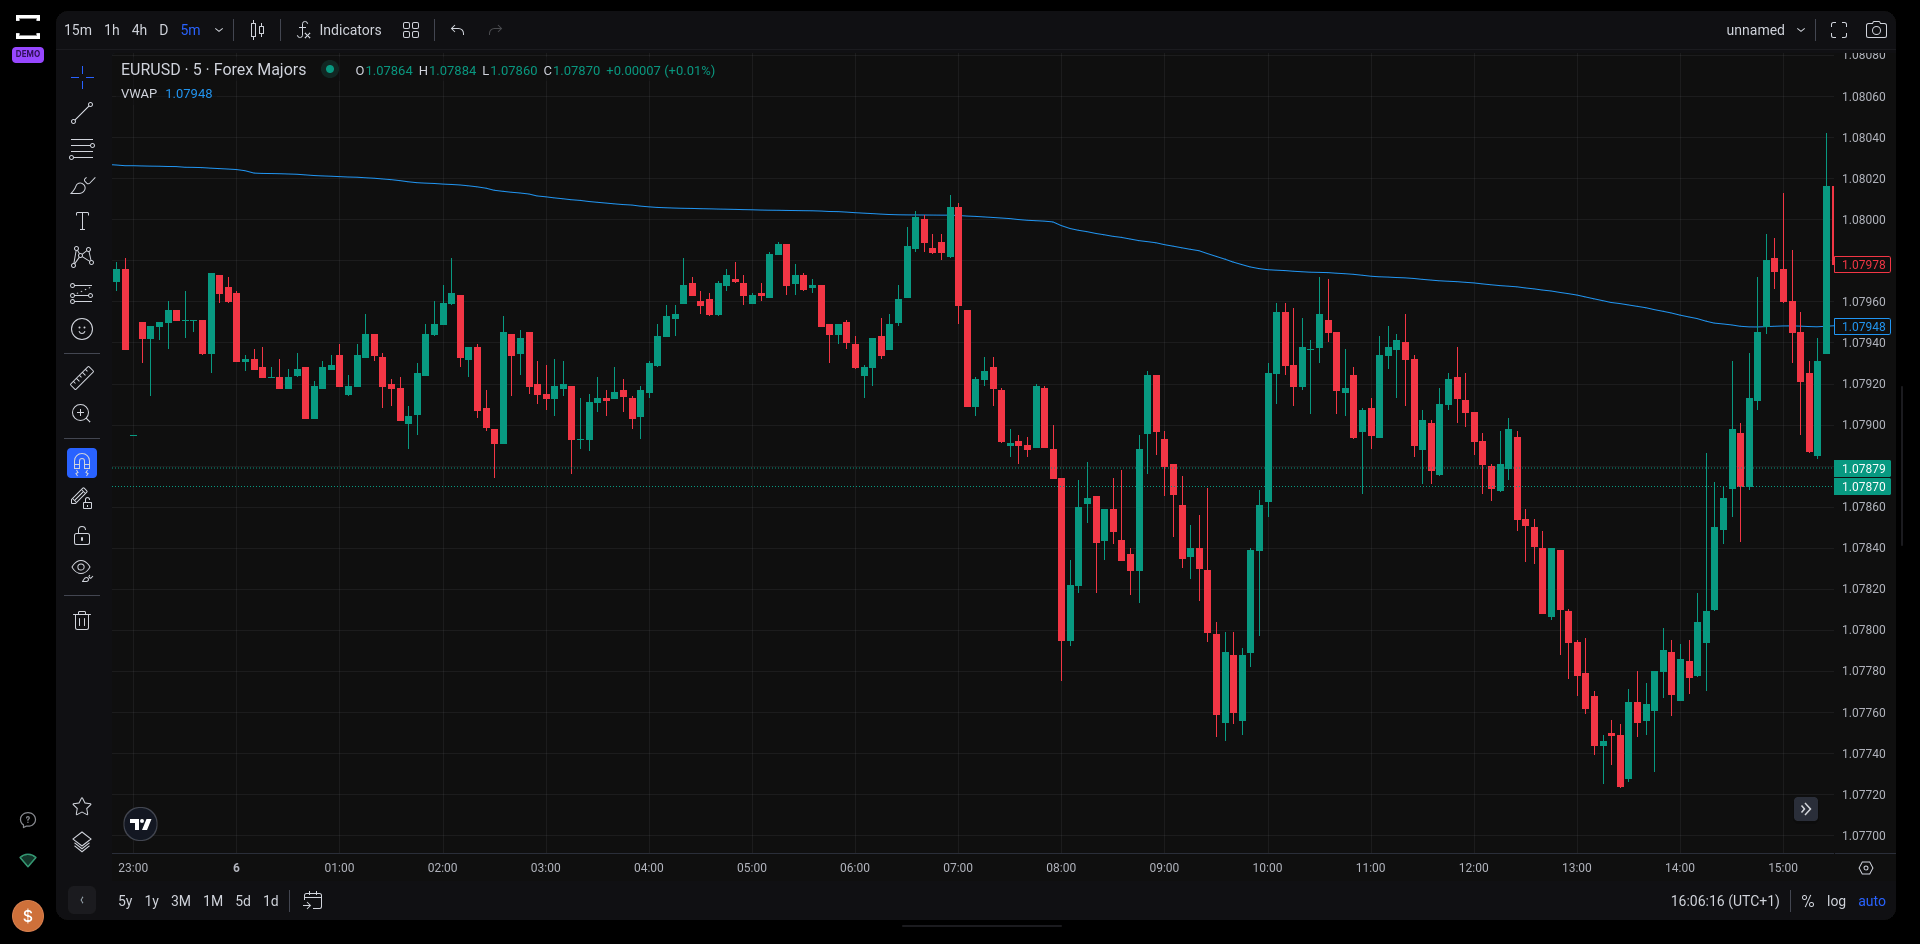
The VWAP TradingView indicator on Tradelocker.
VWAP’s Significance in Market Analysis
The essence of VWAP extends beyond mere price tracking and it contributes to identifying support and resistance levels, as well as supply and demand zones that might not be apparent through standard chart analysis. Its utility is especially leveraged in intraday trading. VWAP acts as a barometer for the market’s trend direction within a trading day – a price above VWAP might signal an uptrend, whereas a price below may indicate a downtrend.
Key Applications of VWAP in Trading
- Intraday Trend Identification: VWAP serves as a compass for discerning the overall direction of prices within a trading day.
- Strategic Entry and Exit Points: It aids traders in spotting potential buying or selling junctures, aligning their decisions with the market’s rhythm.
- Liquidity and Institutional Activity Analysis: The indicator is instrumental in assessing the involvement of large-scale institutional orders (smart money), a critical aspect for any trader.
The Intraday Edge and Its Limitations
VWAP’s distinction as an intraday tool cannot be overstated. It effectively captures the underlying trend of a trading session. However, its reliability is not absolute. Given its nature of aggregating past data to formulate an average, VWAP can exhibit a lag, particularly evident towards the end of a trading day. This lag is more pronounced in shorter time frames, such as a 1-minute chart, where the day’s closing periods might significantly affect the indicator’s responsiveness.
2. SuperTrend
The SuperTrend Indicator is a valuable tool for traders seeking to identify and follow market trends. By utilizing the Average True Range (ATR) and a multiplier factor, the SuperTrend Indicator is adept at signaling potential trend formations, making it an integral part of a trader’s toolkit for trend analysis.

The SuperTrend TradingView indicator on Tradelocker.
Core Functionality of SuperTrend Indicator
At its heart, the SuperTrend Indicator is designed to pinpoint the onset of strong market trends, thus assisting traders in aligning their strategies with the market’s momentum. This indicator shines in its ability to signal trend reversals and provide insights into market volatility. The visual cues are straightforward:
- A shift to red suggests a potential downtrend
- Green indicates an emerging uptrend, determined by the asset’s price relative to the indicator curve
Practical Applications in Trading Strategies
The SuperTrend Indicator is particularly beneficial for strategies that capitalize on trend movements, such as breakout trades or trend-following approaches. Its flexibility is further enhanced by the ability to fine-tune it according to the ATR, allowing traders to adjust entry and exit signals based on the dynamics of price action.
Adjustability for Enhanced Accuracy
To cater to different trading styles and strategies, the SuperTrend Indicator offers customizable settings. Adjustments can be made to the atrLength, which defines the lookback period for the ATR calculation (e.g. 50 or 200 days), and the multiplier, determining the extent of offset from the price. These adjustments can help tailor the indicator to varying sensitivities and market conditions.
Indicator Dynamics on Different Timeframes
The SuperTrend can be effectively applied across various periods (daily, weekly, intraday) and financial instruments (stocks, futures, forex). This versatility makes it a universal tool for a diverse range of trading scenarios.
Balancing Strengths and Limitations
While the SuperTrend Indicator is a robust tool for trend identification, it is not immune to generating false signals, particularly during periods of price consolidation. Thus, incorporating it alongside other indicators such as the RSI (Relative Strength Index, see next paragraph) can enhance its effectiveness and provide a more holistic view of market trends.
3. Relative Strength Index (RSI)
The Relative Strength Index (RSI) is a momentum indicator that plays a crucial role in technical analysis. The RSI assesses the magnitude of recent price changes of an asset to evaluate overbought or oversold conditions. The RSI operates as an oscillator, providing a graphical representation of the strength and weakness in the market based on closing prices over a chosen trading period.
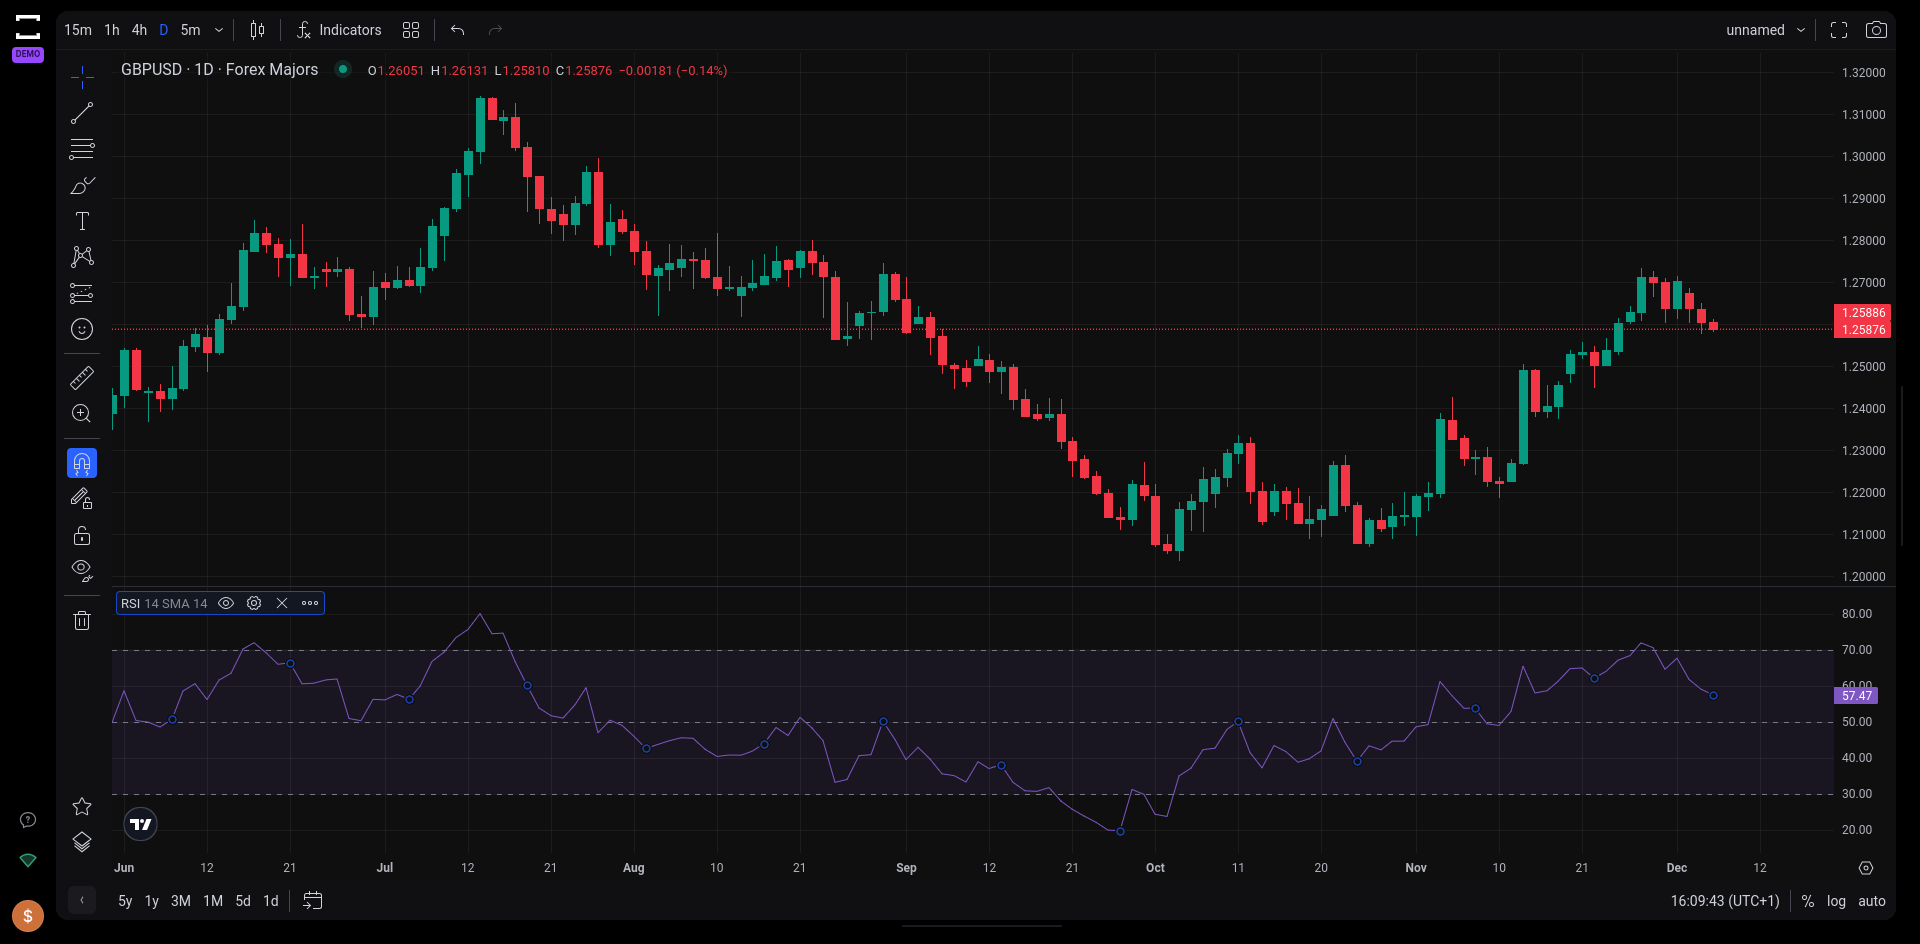
The RSI TradingView indicator on Tradelocker.
Core Mechanics of RSI
RSI values oscillate between 0 and 100, offering a clear metric for market assessment. A value above 70 typically indicates that an asset is overbought, suggesting a potential price pullback or reversal. Conversely, a value below 30 signals an oversold condition, often prompting traders to consider a buying opportunity. The RSI thus becomes a valuable tool for timing entries and exits in trading.
Utilizing RSI in Market Analysis
One of the most effective ways to employ RSI is by spotting divergences between price movements and RSI peaks, much like it happens for currency correlation. For instance, a divergence occurs when the price of an asset creates new highs while the RSI forms lower highs, potentially indicating an impending trend reversal. This aspect of RSI is crucial for identifying shifts in market momentum.
RSI: A Momentum-Based Oscillator
The essence of RSI lies in its ability to measure both the velocity and magnitude of directional price movements. Its calculation is based on the strength or weakness of an asset’s closing prices over a specified period, making it a reliable indicator of price and momentum shifts. The popular 14-day period for RSI calculation is a testament to its adaptability across various timeframes.
A Tool, Not a Standalone Solution
It is crucial for traders to understand that RSI, like all indicators, is not infallible. Relying solely on RSI without considering other market factors or indicators might lead to misleading conclusions. Integration of RSI with other tools such as the SuperTrend can enhance the accuracy and reliability of market analysis.
4. Directional Movement (DMI)
The Directional Movement Index (DMI) is another crucial technical momentum indicator in the arsenal of traders. The DMI combines three indicators – the Average Directional Index (ADX), Plus Directional Indicator (DI+), and Minus Directional Indicator (DI-) – to offer a comprehensive view of market trends.
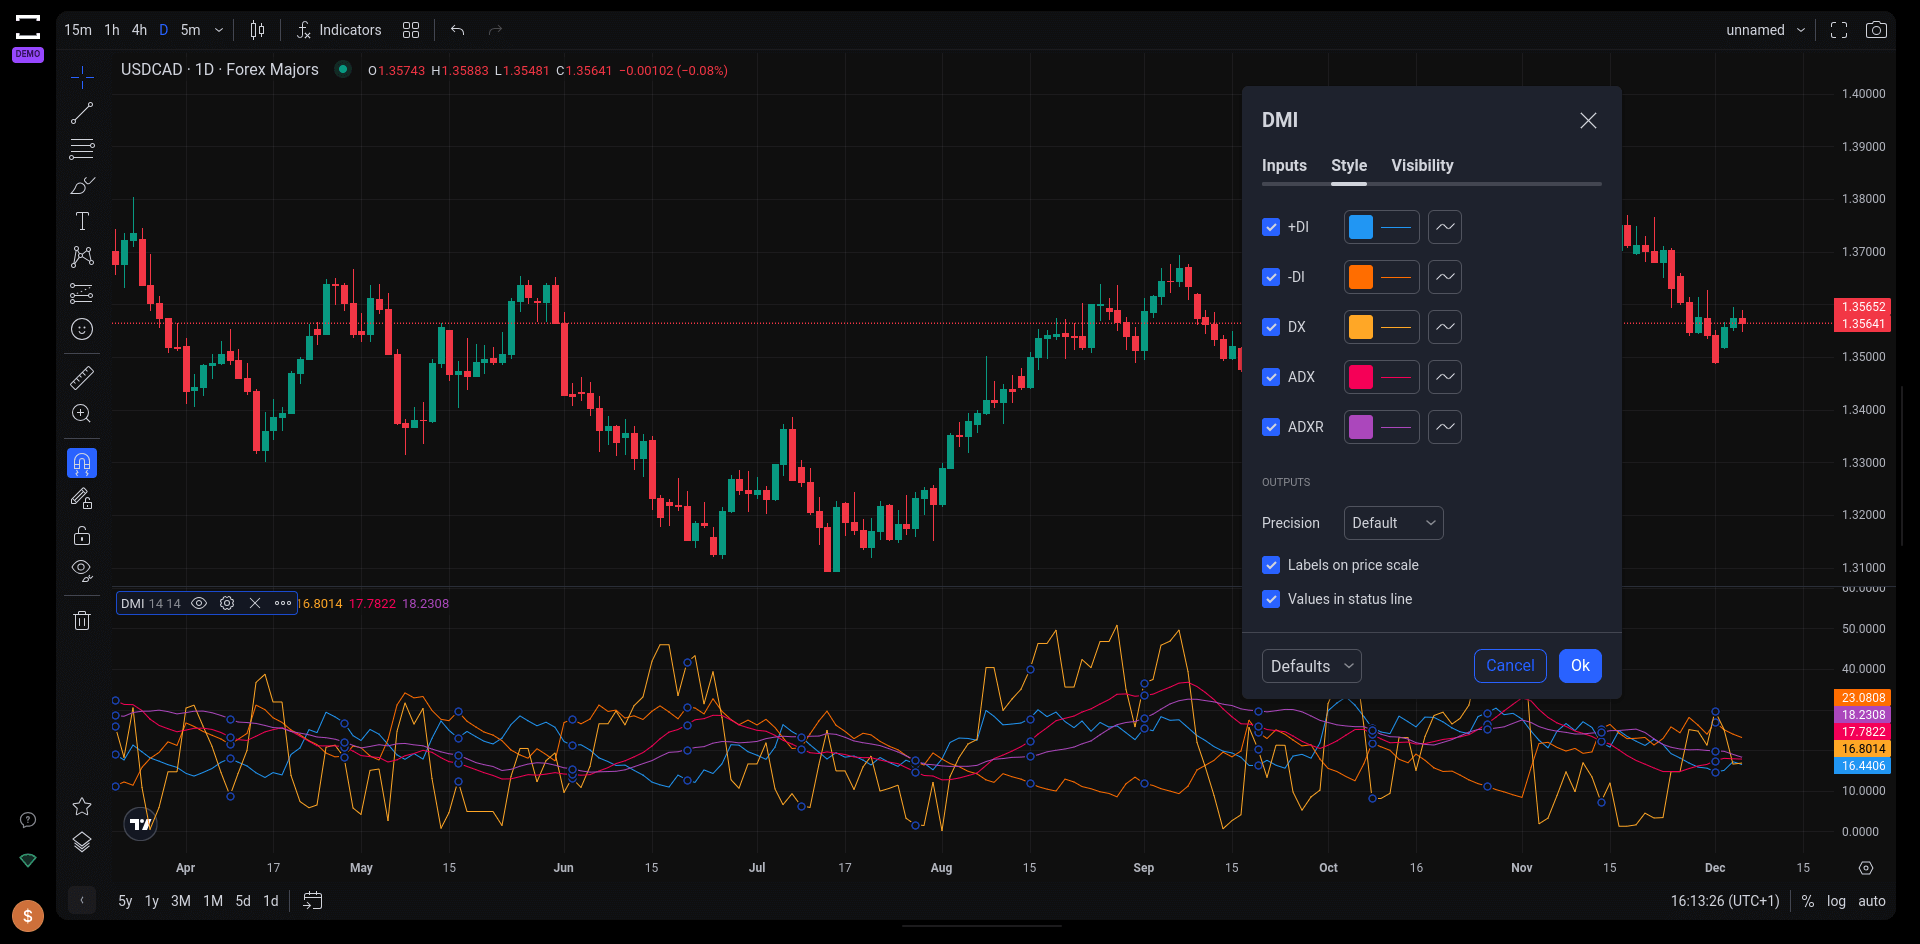
The DMI TradingView indicator on Tradelocker. The overlay is a key for the sub-indicators that make up the DMI.
Understanding the Components of DMI
- Average Directional Index (ADX): The ADX helps measure the magnitude of price movements, irrespective of their direction. A rising ADX above 25 generally signals a robust trend, while a declining ADX points to a weakening trend.
- Plus Directional Indicator (DI+) and Minus Directional Indicator (DI-): These indicators provide insights into the trend’s direction. A DI+ value exceeding DI- suggests an uptrend, whereas the opposite indicates a downtrend.
Practical Application in Trading
Traders can leverage the DMI to make informed decisions on buying or selling, capitalizing on the prevailing trend. The DMI is particularly effective in determining optimal entry and exit points in trades by signaling trend strengths and potential reversals.
Analyzing DMI Signals
- Crossovers: The chart analysis typically involves identifying crossovers between DI+ and DI-. These crossovers can indicate potential shifts in market trends.
- ADX Strength: The strength indicated by the ADX line plays a crucial role in understanding the potency of the trend, guiding traders on when to engage or disengage from a trade.
Interpreting DMI Values
DMI values, ranging between 0 and 100, are instrumental in quantifying the current trend’s strength. The relative positions of DI+ and DI- in conjunction with the ADX value offer valuable insights. For instance, in a strong trend (with ADX above 25), a higher DI+ compared to DI- can suggest a bullish market, while the opposite implies a bearish scenario.
Do I Have to Use All Indicators?
No. Using a lot of indicators will end up creating more problems than it solves. Indicators are useful tools to get a clearer picture of what the market is doing; if you use a lot of them, you’ll end up making a big mess on your chart.
Moreover, indicators don’t always point in the same direction. If you wait for 12 signals to align, you will never take a trade and you will never be profitable.
Our suggestion is to try as many indicators as it makes sense to you, and then pick and choose the ones that work out the best for your trading strategy and understanding of the market.
Part 1 Conclusion
That’s it for part one. Fire up TradeLocker and test out these first four indicators, get a feeling for how they work, and see if they can benefit your trading style.
We’ll see you next week for part 2 and four more of the top TradingView indicators available on TradeLocker.
Happy trading!
Ready to become a funded trader? Start Now.