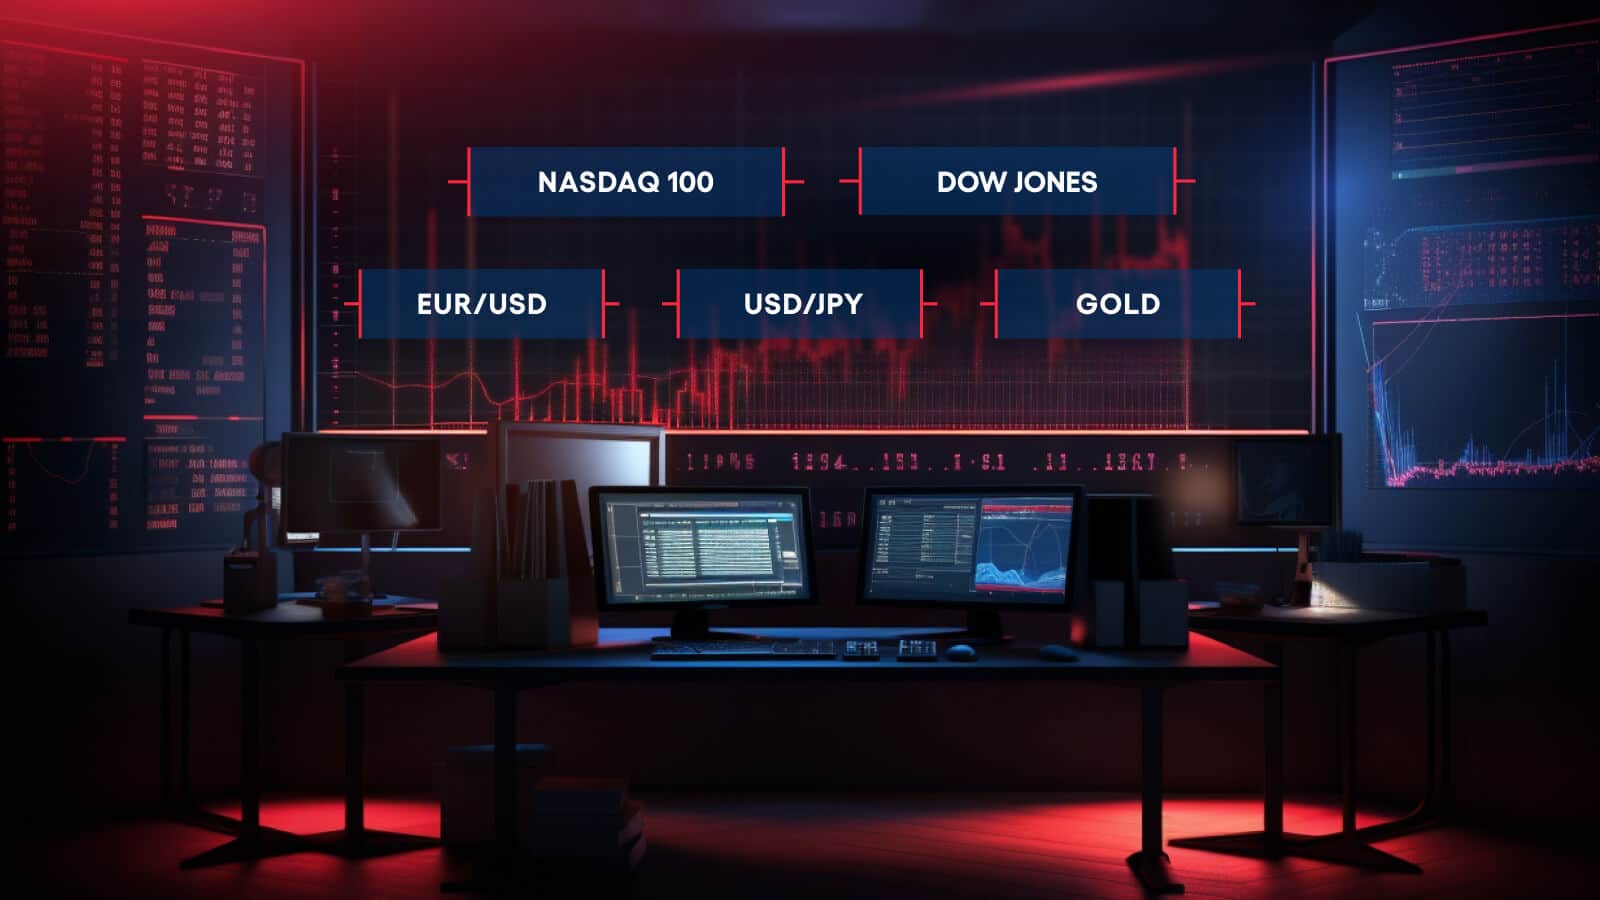
Key Takeaways:
- The Nasdaq 100 holds America’s biggest tech companies including Apple, Amazon, and Nvidia.
- The USD/JPY pair could be so tricky, the industry has coined a term for its trade – Widow Maker.
NAS100: America’s Top Tech Companies
Tip: Know What’s Inside the Nasdaq 100
The Nasdaq 100 is part of the technology corner of the US stock market. The index is made up of more than 100 non-financial companies. These are called large-cap companies for their formidable size in terms of market capitalization.
Essentially, when you buy or sell the Nasdaq 100, you buy or sell all of the companies inside of it. Some of the biggest names in there are iPhone maker Apple, Google parent Alphabet, e-commerce mainstay Amazon, chip juggernaut Nvidia, and many more.
Tip: Watch for Earnings Updates
The Nasdaq 100 companies boast some of the world’s biggest market valuations. A single one of them can weigh on the index or drive it higher. Therefore, it’s important for you to learn how to navigate the earnings calendar if you want to anticipate the index’s next move.
Earnings reports are released every quarter, four times a year. Usually, the tech companies are all lined up to report within a single week during the earnings season. That means a lot of leeway for the Nasdaq 100 to move around. Closely monitoring earnings updates will give you an edge when trading this tech-heavy index.
XAU/USD: Gold as a Safe Haven Asset
Tip: Understand Geopolitical Events
Gold, the world’s most well-known asset to provide wealth preservation. The global gold market is estimated to be worth around $13 trillion. The precious metal is seen as a store of value thanks to its characteristics of being relatively scarce, long-lasting, and very very old.
Traders broadly flee to gold when the global economy starts showing signs of weakness. In this light, gold prices tend to move higher when traditional assets like stocks go down, weighed by economic concerns. Keeping an eye on economic events and geopolitical developments can help you anticipate gold’s trajectory.
Tip: Know How Inflation Affects Gold Prices
Inflation plays a vital role in gold’s valuation. There’s a hypothesis that speaks of an existing correlation between inflation and gold. More precisely, when inflation goes up, gold goes up. What is inflation? It’s the increase in the prices of goods and services, which knocks the purchasing power of money.
To that end, traders prefer to put their cash into gold during inflationary periods in order to avoid the depreciation of their money. That’s why gold is historically referred to as a hedge against inflation. Its value tends to rise when fiat currencies lose their shine.
US30: The 30-Stock Blue-Chip Benchmark
Tip: Know the Dow Jones 30 Components
The Dow Jones Industrial Average (ticker: US30) is a US stock index that comprises 30 publicly traded companies. Those companies are commonly known as value companies for their ability to preserve value over very long periods of time. For that reason, these 30 companies are called blue-chip stocks – they are reliable and have a good history.
They are worth less than technology companies, which are considered growth companies. Some names listed in the Dow Jones index include banking heavyweight Goldman Sachs, but also burger-flipper McDonald’s and entertainment giant Disney.
Tip: Understand the Dow’s Relationship with the Economy
The Dow Jones companies are deeply entrenched in the economy. That’s why the index is oftentimes used as a gauge for economic growth and stability. While those stocks are in less glamorous, old-fashioned industries, investors are quick to buy them or sell them, depending on the health of the US economy and the spending power of the American consumer.
Two main indicators will help you know when to buy or sell the Dow Jones Industrial Average. The first one: the nonfarm payrolls report. Or simply called the jobs report. This is perhaps the most important measure of the health of the US economy. It shows how many new jobs have been added over the course of a month. And it tends to sway the Dow Jones, depending on the figure – if the economy is growing, the 30-stock index is gaining, and vice versa.
EUR/USD: The Most Volatile Pair of All
Tip: Use Technical Analysis
The EUR/USD currency pair is the most traded one in the entire forex market. Every day, billions of dollars are exchanged for euros as currency traders aim to capitalize on the daily volatility of the exchange rate.
These moves are closely watched by technical analysts with the intention of foreseeing the next leg up or down. By observing the movements on the chart, you can get insights into the patterns of the price and attempt to open a position to soak up its next move. Indicators like moving averages and oscillators can help you identify trends and potential entry and exit points.
Tip: Grasp Market Sentiment
Sentiment in the forex market can change rapidly, especially in a volatile pair like the EUR/USD. Monitor news and market sentiment indicators to gauge the overall mood of traders. Extreme bullish or bearish sentiment can sometimes signal potential reversals.
The EUR/USD pair is most liquid during the overlap of the European and US trading sessions. This is also the time when economic reports get released, injecting fresh volatility into the exchange rate. Consider trading during these hours for better liquidity and potentially tighter spreads.
USD/JPY: The Bank of Japan’s Quirky Policy
Tip: Monitor the Bank of Japan
Japan’s central bank, the Bank of Japan, is responsible for setting the country’s monetary policy. It does that mainly by tweaking interest rates. If you can anticipate the Bank of Japan’s next turn, you can reap big rewards from the volatile Japanese yen as it trades against the US dollar.
But be careful, the Bank of Japan is perhaps the most unpredictable central bank out there. In fact, the industry has coined a term for trading against the Bank of Japan and trying to front-run it. The name of that trade is Widow Maker, as it has phased many traders out of business.
Tip: Implement Robust Risk Management
Due to the USD/JPY’s uncertain trade behavior, make sure to set stop-loss orders to limit potential losses and take-profit orders to secure profits. Determine your risk tolerance and position size to manage your exposure effectively.
It’s not unusual for the USD/JPY to move by 200 to 500 pips in a day. For this to happen, there is likely a surprising twist coming out of Japan, its economy, or its central bank.
Ready to become a funded trader? Sign Up Now.